-By Anuj Sethi, Senior Director, CRISIL Ratings

The commercial vehicle (CV) industry is projected to see revenue growth moderate to mid-single digit this fiscal compared with a healthy 12% last fiscal and a robust 48-50% in the previous two years, which had benefited from pent-up demand from the pandemic period.
CVs cover a broad spectrum of vehicles, ranging from light commercial vehicles (LCVs) to medium and heavy (MHCVs). LCVs represent around 60% of the domestic volume, while MHCVs represent the remaining share. In our analysis, buses are classified as both LCVs and MHCVs.
This fiscal, revenue growth will be driven by price increases even as volume growth in the domestic market is expected to be modest for MHCVs and flattish for LCVs. Exports will see only a gradual revival amid a slow recovery in economic activity in key export destinations. With higher realisations and stable input prices, the industry is expected to sustain an operating margin of 10-11% this fiscal, in line with the performance in the previous fiscal.
A CRISIL Ratings study of four leading CV markers, commanding a substantial 70% of the market share, indicates as much.
Over the medium term, however, the government’s steadfast focus on infrastructure projects, accelerated industrial activity, booming e-commerce and shift to cleaner fuel technology should serve as the primary growth drivers. A closer look indicates how the trends will play out.
Volume growth to be modest this fiscal
A crucial segment of India’s automotive sector, the CV industry is a key indicator of the country’s economic strength. While it represents only 4% of domestic sales by volume, it is the second-largest revenue contributor, constituting close to one-third of the total revenue for the automotive industry.

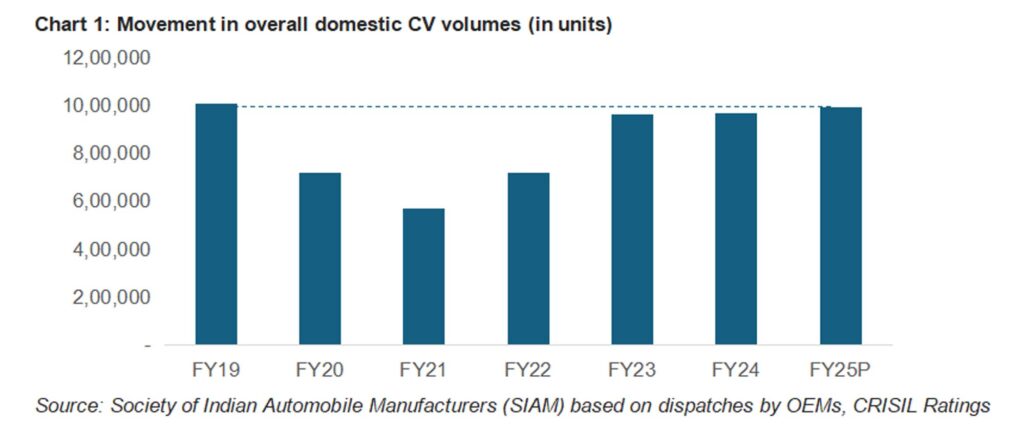
In fiscal 2025, domestic CV volumes – accounting for over 90% of total sales – are projected to experience a modest growth of 1-3%, reaching 9.9 lakh units.
That will represent a recovery to 0.98 times of the previous peak level of fiscal 2019 (see chart 1). Steady demand from key end-user sectors including industrial manufacturing, mining, construction, roads, real estate, and logistics, as well as replacement demand, will uphold overall volumes.

MHCVs volume to see modest increase amid election impact, normalisation of demand for buses
Sustained economic growth, fuelled by expansion of industrial activity and infrastructure development, will propel demand for MHCVs in India. The government’s focus on large-scale infrastructure projects, urban development initiatives and the expansion of national highways will be the primary drivers of demand for MHCVs over the medium term.
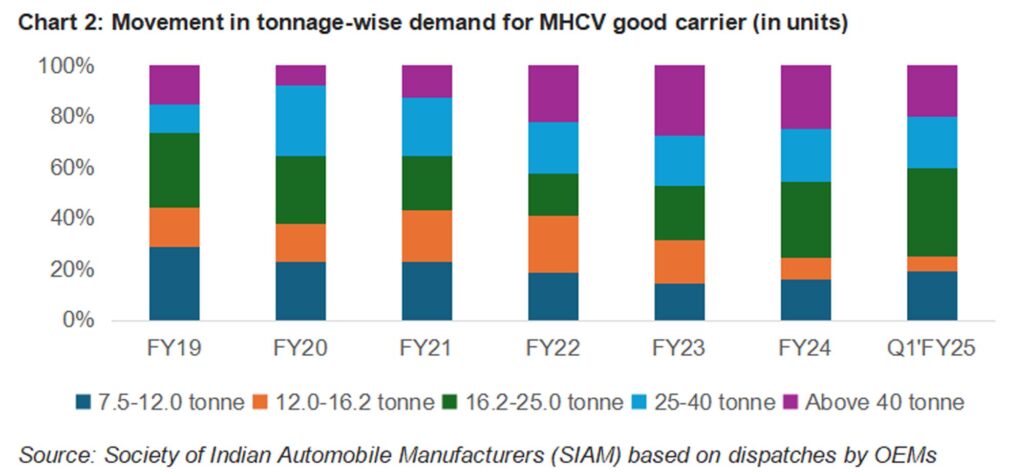
That said, a temporary slowdown in infrastructure spending in the first quarter due to general elections and persistently high interest rates in the first half of the year are expected to impact demand this fiscal, particularly for higher tonnage capacity vehicles such as multi-axle/trailer vehicles with over 40 tonne capacity whose share has increased to around 25% over the previous three fiscals from ~15% prior to the pandemic (refer to Chart 2).

Stable demand for replacing old vehicles, driven by increasingly stringent regulatory norms around emissions and vehicle safety and steady demand for large buses from transportation-linked sectors such as educational institutions, tour operators and state transportation undertakings, will partially counteract the impact and drive overall MHCVs volume growth in the low-to-mid single digits this fiscal.
LCV growth to be flattish; sub-one tonne facing competition from electric three wheelers
Demand for LCVs, which encompasses vehicles such as small trucks and delivery vans, is influenced by rapid growth in e-commerce and last-mile delivery services. These vehicles are especially well-suited for urban and semi-urban transportation needs.

This fiscal, demand for LCVs is expected to remain subdued due to a high base and moderation in spends by e-commerce players. Tonnage-wise, demand for small CVs – in the 3.5 to 7.5-tonne capacity range, needed for cargo shipments – will support overall LCV demand.
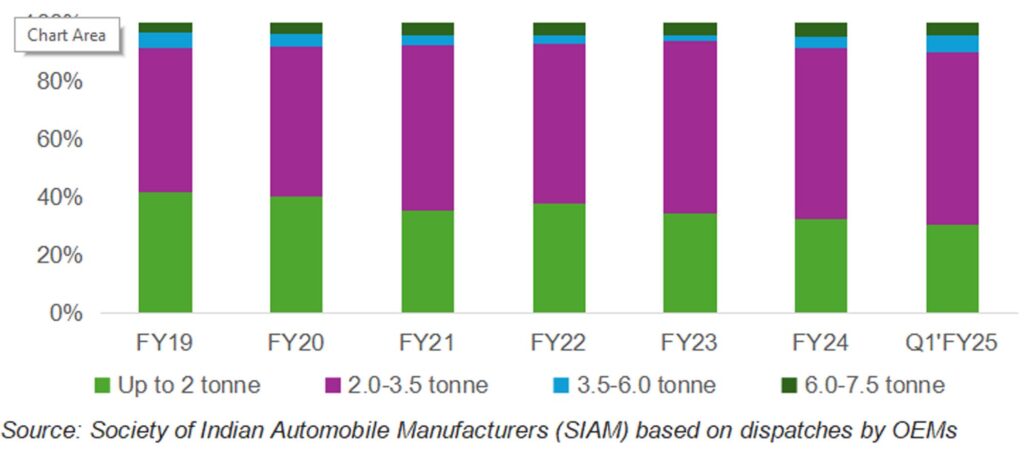
Other LCV segments could, however, experience flattish to marginal de-growth, especially the sub-one tonne category, due to stiff competition from electric three-wheeler goods carriers (refer to Chart 3).
Chart 3: Movement in tonnage-wise demand for LCV goods carriers (in units)
Significant revival in export demand contingent upon strong recovery in key export countries
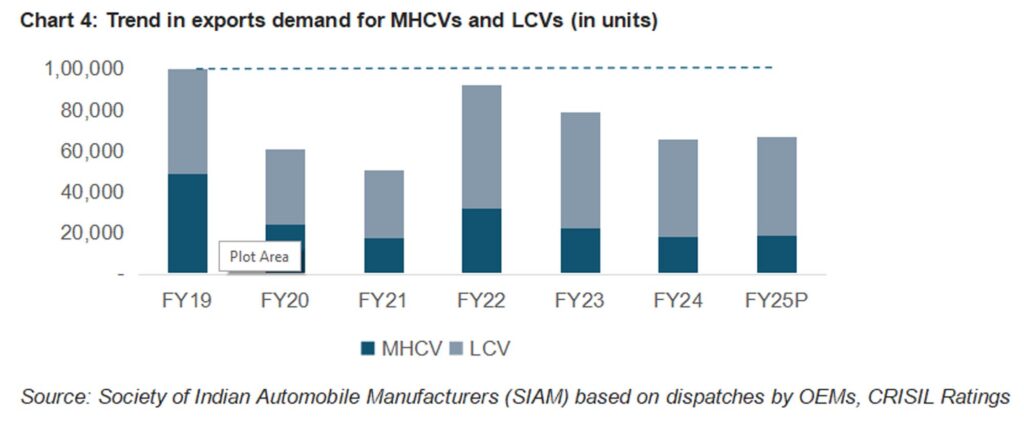
The exports volume, representing around 10% of the CV industry’s total volume, has been on a downward trend for the last two fiscals (refer to Chart 4) due to inflationary pressures and an economic slowdown in key markets such as Africa, Latin America and Southeast Asia.
A gradual recovery seen in economic activity in these countries will drive an increase in exports demand, albeit at a slow pace. And LCVs shall see relatively faster recovery compared to MHCVs.
Shift to alternative fuels, especially CNG, to gain over the medium term
The decline in the market share of compressed natural gas (CNG) models observed in fiscal 2023 continued into fiscal 2024 for both LCV and MHCV segments, with a marked decrease to around 11% and 3% respectively from ~15% and 11% two years earlier, i.e. in fiscal 2022 (refer to Chart 5).
With the government’s continued focus on sustainability, a gradual transition towards vehicles powered by alternative fuels such as electric and CNG is anticipated. This transition, bolstered by government incentives and policies will, in turn, drive demand over the medium term.
Stable input prices, price hikes to help sustain operating margin despite modest volume growth
The price hikes undertaken by original equipment manufacturers at the beginning of this fiscal, coupled with steady raw material costs (particularly of steel, iron and aluminium), are expected to uphold the operating margins of CV manufacturers at 10-11%, similar to the previous year.
The modest increase in volumes will increase capacity utilisation of CV makers slightly to 72-74% this fiscal, from 70-72% last fiscal, obviating the need for significant capacity addition and keeping capital spend in check.
This, combined with stable cash flows and robust balance sheets, will ensure an improvement in key debt metrics of CV makers. For players rated by CRISIL Ratings, interest coverage and debt to earnings before interest, tax, depreciation, and amortisation is expected to remain strong at 8-10 times and 0.9-1.1 times, respectively, for this fiscal, slightly better than in the previous one.
That said, given that CV fortunes are linked to macro and industrial growth, the pace of economic activity, interest rate movement, inflationary pressures, movement in fuel cost and regulatory changes will bear watching as these can affect the demand and price of vehicles.